
Instagram Engagement Trends: What Changed in the Last 12 Months
Instagram engagement rates fell again this year, shares passed likes as a ranking signal, and carousels pulled further ahead of Reels. Here is what the data actually shows.
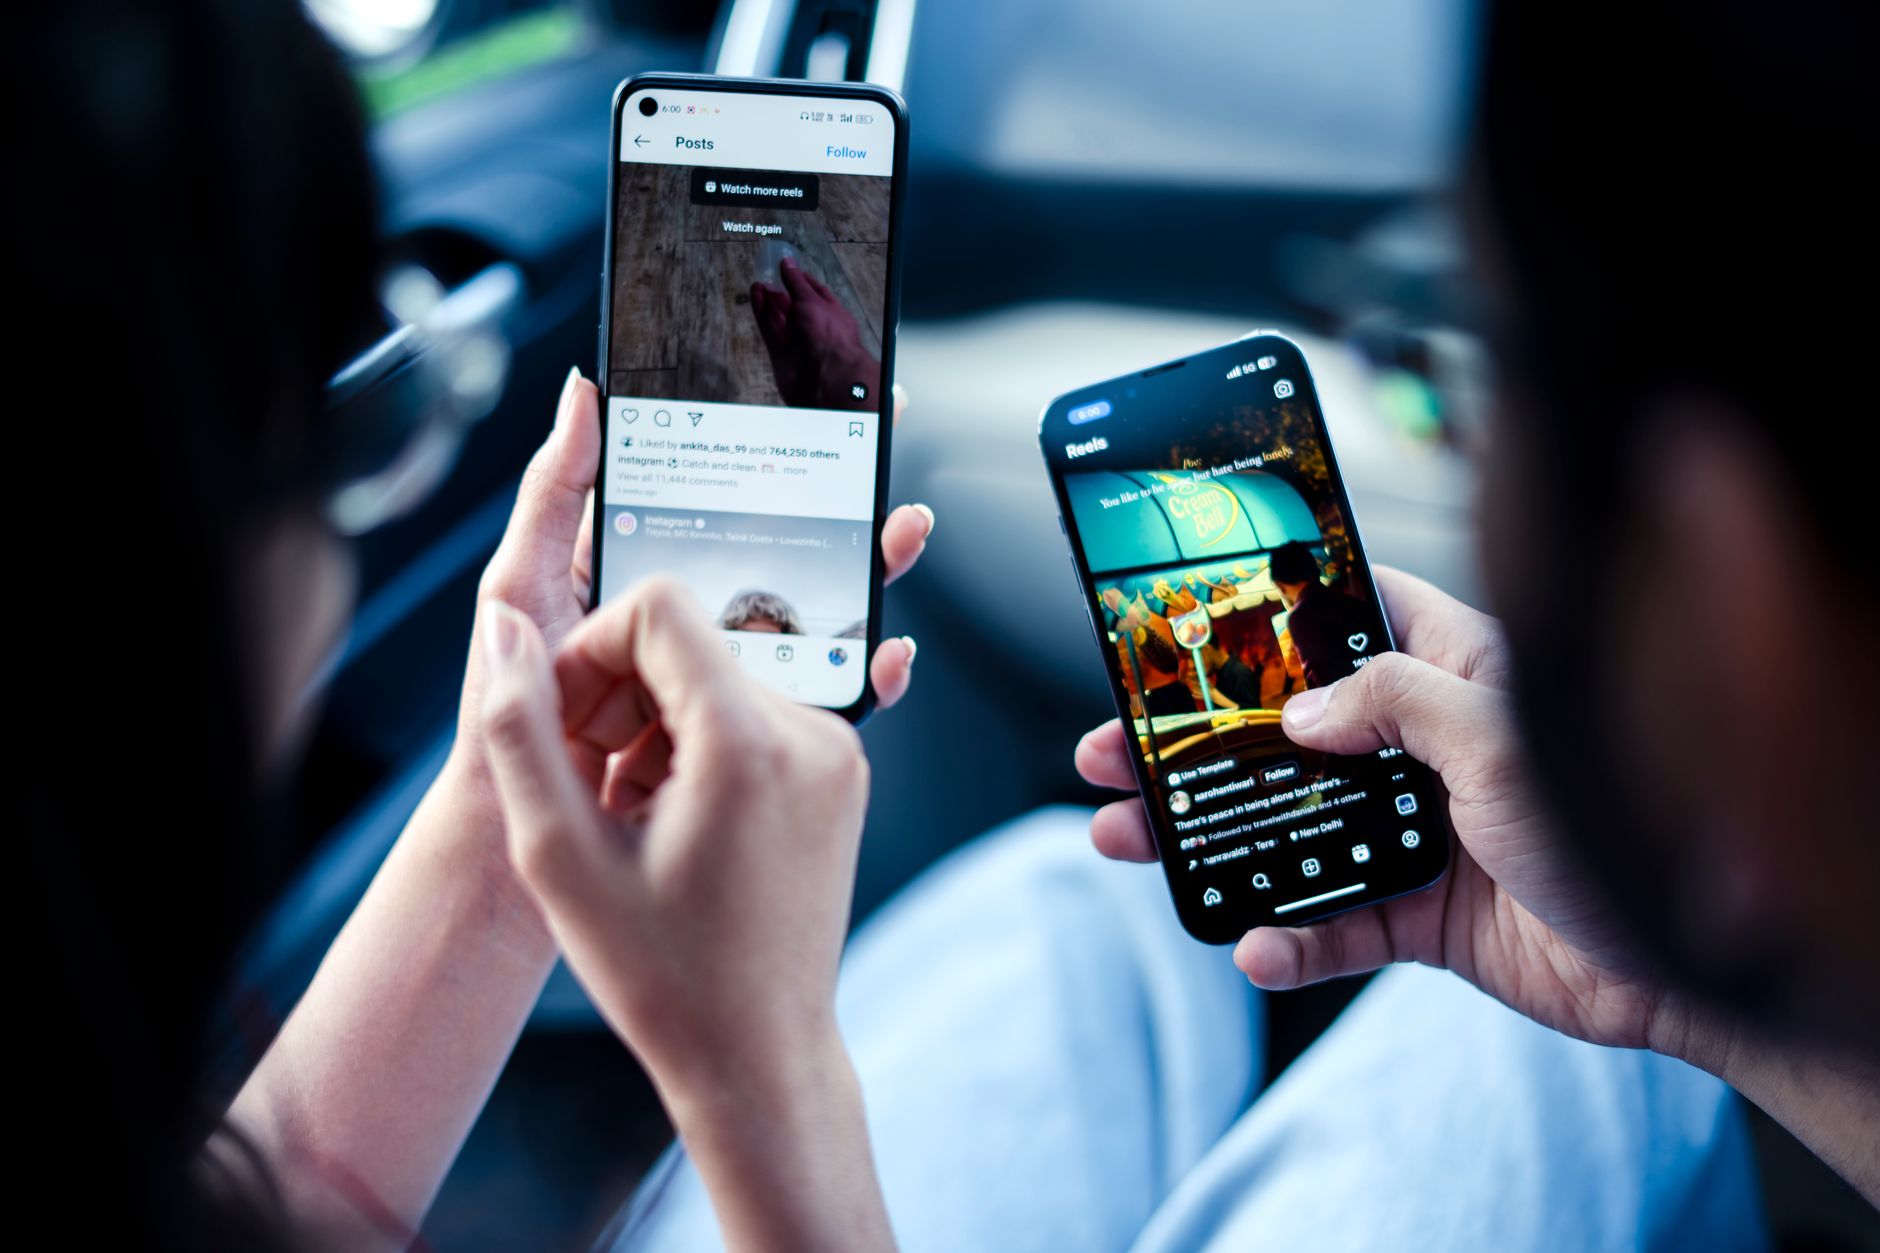
Instagram engagement rates fell again this year, but the bigger story is what counts as engagement in the first place. Shares and sends have moved ahead of likes as a ranking signal, carousels are pulling further away from Reels on a per-impression basis, and the gap between small and large accounts is as wide as ever. None of this means Instagram stopped working for brands. It means the metrics worth watching changed.
Here is what the last 12 months of data actually shows, and what to do about it if you run an Instagram account for a brand.
The headline number: engagement is down again
Socialinsider’s 2026 benchmark study, built from 35 million posts across 447,613 accounts tracked through 2025 and into this year, puts the average Instagram engagement rate at 0.48 percent in Q2 2026. That is a 24 percent year over year decline. Broken down by format, carousels averaged 0.50 percent in Q2 2026 versus 0.55 percent a year earlier, Reels slid from 0.52 percent to 0.48 percent, and static images fell the hardest, down 17 percent to 0.33 percent.
The report’s own explanation is worth repeating because it is not the usual “the algorithm hates you” line: the decline is structural. More accounts are posting more often into the same amount of user attention, and more of that attention is moving into private engagement, shares and DMs, that never shows up as a public like or comment. A brand comparing this year’s numbers to last year’s is not failing. It is competing in a more crowded feed where the easy, public forms of engagement are naturally thinner on the ground.
Carousels vs. Reels: the gap depends on what you measure
Buffer’s analysis of more than 4 million posts between January 2022 and October 2024 tells a sharper version of the same story. By that measure, carousels earned a 6.90 percent median engagement rate, more than double the 3.31 percent for Reels and well ahead of the 4.44 percent for single images. But Reels are not losing on every axis: they reached 36 percent further than carousels and 125 percent further than single images, largely because Instagram still pushes Reels into the feeds of people who do not already follow the account.
The two studies do not contradict each other so much as measure different things. Socialinsider’s numbers are smaller and closer together because they track engagement against follower count across a huge, mixed sample. Buffer’s numbers are larger and more spread out because they track engagement against reach, which rewards formats that get seen by fewer but more interested people. For a brand, the practical takeaway is the same either way: Reels are a reach tool for getting in front of new people, and carousels are an engagement tool for getting a reaction out of the people who already see your content. Running both, deliberately, beats defaulting to whichever one is trending this month.
Shares passed likes as a ranking signal
The clearest confirmed algorithm change of the last 12 months is that sends and shares are now among the most important ranking signals Instagram uses across feed, Reels and Explore, a shift Adam Mosseri has pointed to directly. The logic is straightforward: a like costs a viewer nothing, but sending a post to a specific friend is a deliberate act that signals the content is worth spreading. Instagram’s ranking systems now weight that signal more heavily than passive taps.
This is the detail most engagement rate calculators still miss, since the standard formula only counts likes, comments and sometimes saves. A post with modest likes but a high forward rate can be outperforming the algorithm’s expectations in a way the public numbers never show. If you have not revisited how you calculate engagement rate in the last year, this is the reason to do it now rather than later.
Saves and shares need their own line in reporting
Most monthly reports still lump saves and shares into a single “engagement” total alongside likes and comments, which hides the exact shift that matters most this year. A like and a save are not the same signal. A like is a passing reaction. A save means someone expects to come back to the post, which is a much stronger statement about the content’s value, and it is one of the inputs Instagram’s own ranking systems weight more heavily than a like. Reporting them separately, even in a simple two-column breakdown, makes it obvious whether a format is earning shallow approval or real intent to return.
This matters more for carousels than for any other format, since carousels tend to concentrate saves on one or two slides rather than spreading interest evenly across a post. We went into the mechanics of this in Instagram save rate and share rate, the metrics everyone ignores, which is worth a read if your current dashboard still treats a save the same as a like.
Account size still decides your baseline
Follower count keeps dictating what a normal engagement rate looks like. Recent 2025 to 2026 data compiled by Upgrow puts nano accounts, 1,000 to 10,000 followers, at an engagement rate between 2.19 and 6.23 percent. Mid-tier accounts in the 50,000 to 500,000 range sit at 0.86 to 1.80 percent, and mega accounts above a million followers run as low as 0.50 to 0.94 percent, with the largest celebrity accounts over 10 million followers averaging just 0.35 percent.
The pattern is consistent across every study cited here: smaller, more engaged audiences outperform larger, broader ones on a percentage basis almost every time. For a brand benchmarking its own account, the comparison that matters is against accounts of a similar size, not against the industry average or a competitor with ten times the following. This is also why follower count alone is a weak proxy for how healthy an account actually is. We covered the broader version of this problem in the shift from follower count to audience quality, and the same logic applies when you are reading engagement benchmarks: context beats raw numbers.
What to actually track going forward
Three changes are worth making to how a brand reads its own Instagram performance over the next year:
- Compare engagement rate against accounts of a similar follower size, not an industry-wide average that mixes nano accounts with mega accounts.
- Track saves and shares alongside likes and comments. They are now closer to what the algorithm actually rewards, and raw like counts increasingly undercount real interest.
- Treat Reels and carousels as different jobs rather than competing formats. Use Reels to reach people who do not follow the account yet, and carousels to get a stronger reaction from the people who do.
Pulling these numbers by hand from the native Instagram app every week gets tedious fast, especially once a brand is tracking more than one account or comparing itself against competitors. Hexrate’s Pulse dashboard tracks engagement rate, saves and shares by format automatically, so the comparison above takes a glance instead of a spreadsheet. It is also worth revisiting what counts as a vanity metric versus a real one before building a reporting routine around last year’s assumptions, a topic we broke down in vanity metrics vs. real metrics.
Engagement rates will likely keep drifting down as more brands and creators compete for the same attention. The accounts that keep growing anyway are the ones that adjusted what they measure, not just how often they post.
Smart marketers run Instagram with Hexrate!
See what it can do for you.
Pulse, Discover, Campaigns, and Reports & Media Kit: one platform for your whole Instagram workflow. No follower-count promises, just real data.
Get started
What the data actually says about caption length, hooks, CTAs, emojis, and hashtags, so creators can stop guessing and start writing captions that earn comments.

Learn how to find Instagram influencers who match your best-performing partner on audience, engagement and format, not just niche or follower count.

A look at where influencer fraud actually costs brands money, how common it is, and the checks that catch it before a contract is signed.

What the FTC actually requires for sponsored content disclosures on Instagram, and what brands and creators risk by getting it wrong.

A side by side look at how influencer marketing and traditional advertising differ in trust, targeting, cost and measurement, and where each still wins for…
 English
  Español
  Deutsch
  Română
  Français
  Italiano
  Polski
  Português
  Українська
  Русский
  Lietuviškai
  Türkçe